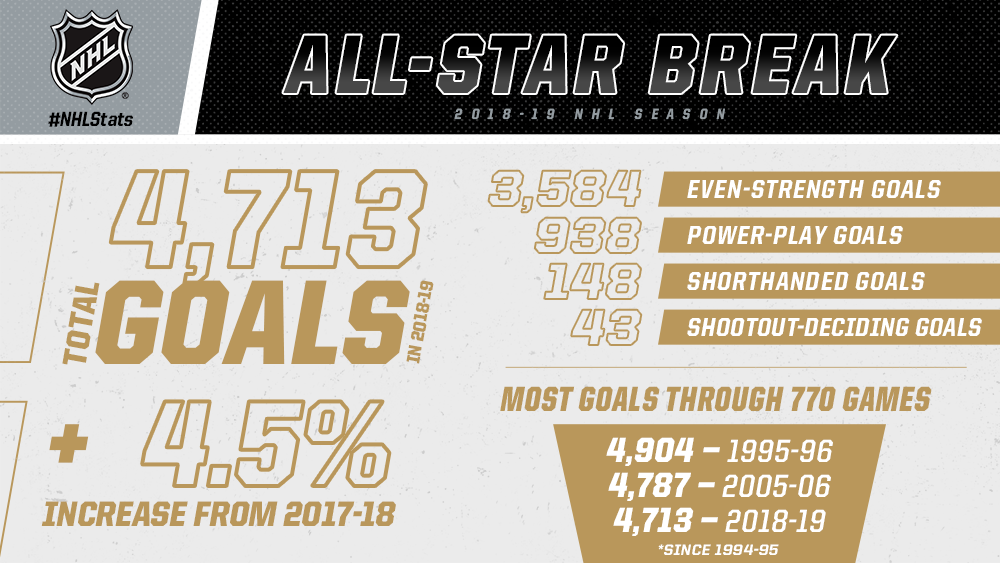
* Four players have scored at least 30 goals this season, the highest such total at the All-Star break since 2009-10 (8). Forty skaters have hit the 20-goal mark in 2018-19, the most through 770 games in a season since 2006-07 (40).
* Thirty-three players have collected at least 50 points this season. The last campaign to feature as many 50-point getters through 770 games was 1996-97, when 36 skaters had reached the plateau.
* Forty-one players are averaging at least one point per game this season (min. 25 GP), including 19 age 25 or younger (46.3%). The last NHL campaign to enter the All-Star break with as many players averaging at least one point per game (min. 25 GP) was 1995-96 (41).
* Sixty-one hat tricks have been scored this season, including at least one in 10 of the past 13 days dating to Jan. 11. The last campaign to feature as many three-goal performances through 770 games was 1995-96 (62).
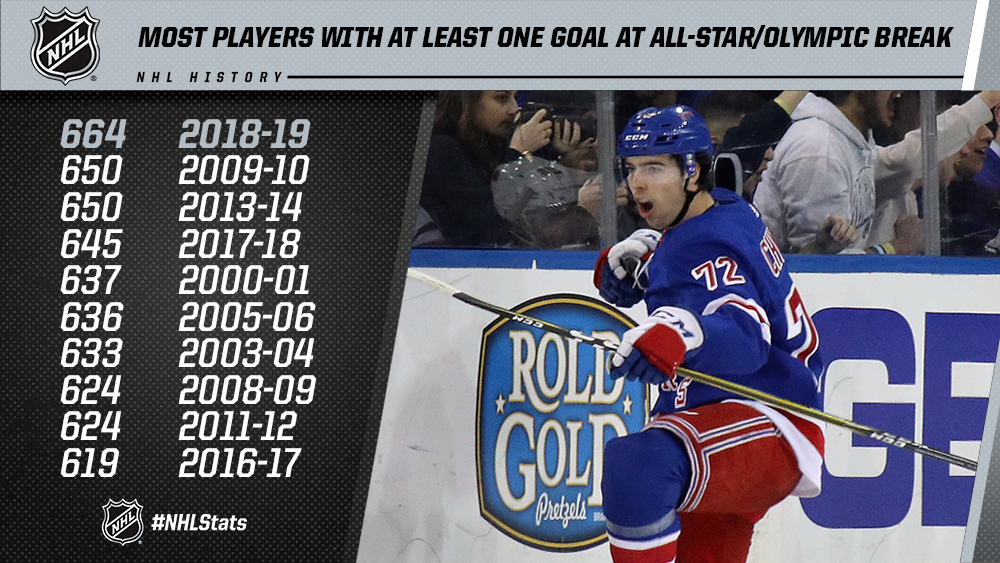
* A total of 664 players have scored at least one goal in 2018-19, by far the most-ever in an NHL season entering the All-Star break.
* The 2018-19 campaign has featured 345 instances of a team overcoming a deficit of any kind to win a game, the most-ever comeback victories through 770 contests in an NHL season. There have been 96 instances of a team overcoming a multi-goal deficit to win in 2018-19; only two seasons in League history have featured as many multi-goal comeback wins through 770 games – 1985-86 (112) and 1987-88 (98).
* There have been 355 total lead changes this season (across 290 of the 770 GP), the most at this stage of a season since 2005-06 (369 total lead changes; across 292 of the 770 GP). The 68 third-period lead changes in 2018-19 are tied (w/ 2012-13) for the most through 770 games since 2006-07 when there were 70.
* Nearly three quarters of the games that have required extra time in 2018-19 have ended in the 5:00 overtime period (73.6%; 120 of 163), by far the highest such percentage at this stage of a season in the shootout era (since 2005-06).
* There have been 33,642 hits recorded this season for an average of 43.7 per game – in line with each of the past two seasons (42.9 in 2017-18 and 43.8 in 2016-17); aside from last season, every campaign since 2009-10 has averaged 43 or more hits per contest at the All-Star break. Fifty-three players have registered 100 or more hits this season.
DID YOU KNOW?
* Four teams who were not part of the 2018 Stanley Cup Playoffs currently hold a postseason position, including two division leaders (Eastern Conference: Islanders and Canadiens; Western Conference: Flames and Stars). Overall, 23 teams either possess or are within four points of a playoff berth.
* Since 2002-03, the eventual Presidents’ Trophy winner also was in first place through 770 League games in four campaigns: 2007-08 (DET), 2010-11 (VAN), 2015-16 (WSH) and 2016-17 (WSH).
* This marks the 10th time in NHL history that multiple Canadian clubs enter the All-Star break as division leaders and just the fifth such instance since Montreal won the Stanley Cup in 1993 (the last championship by a Canadian club). The other four instances in that span: 1993-94 (CGY and TOR), 2002-03 (VAN and OTT), 2005-06 (CGY and OTT) and 2009-10 (OTT and VAN).
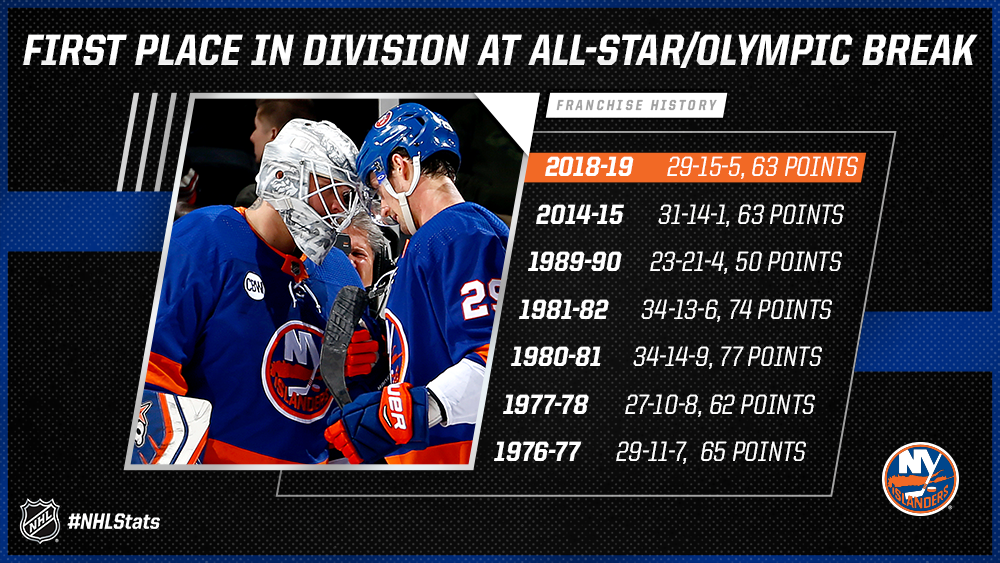
* The Islanders enter the All-Star break as division leaders for the seventh time ever, with the last such occurrence coming in 2014-15.
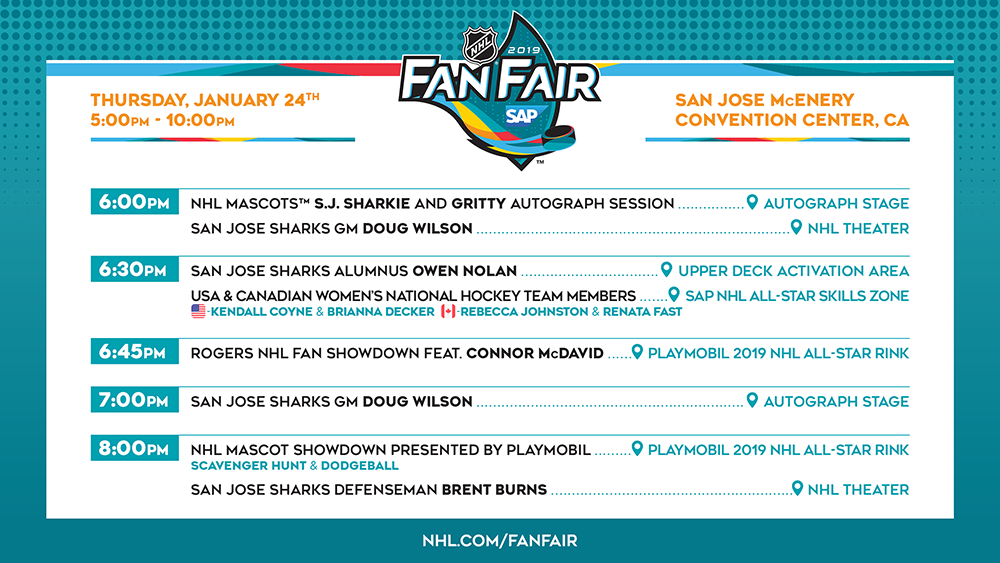
SNEAK PEEK AT 2019 NHL FAN FAIR PRESENTED BY SAP
The 2019 Honda NHL All-Star Weekend begins Thursday with the NHL Fan Fair presented by SAP. Autograph sessions with local favorite S.J. Sharkie and Gritty will kickstart the evening’s festivities, followed up by a Hockey Hall of Fame exhibit showcasing the Sharks and history of hockey in Northern California.

Create an Account
In order to leave a comment, please create an account.